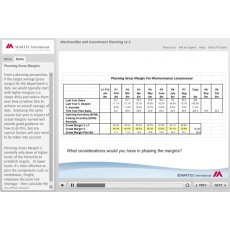
Sales and Inventory Management E-Learning Course
Item: EL36
The course provides a thorough grounding in key sales and stock management principles and concepts. It is suitable for retailers and manufacturers operating in both category management and merchandise management environments. Scroll down for course objectives and detailed content.

![]() In stock
In stock
Description
Sales and Inventory Management
The course provides a thorough grounding in key sales and stock management principles and concepts. It is suitable for retailers and manufacturers operating in both category management and merchandise management environments.
Who Is It Suitable For?
This course is for everyone involved in sales and inventory management including:
- Merchandisers and their teams
- Buyers and their teams
- Supply chain managers and their teams
- IT departments
- Vendors supplying and selling inventory management systems.
Course Objectives
By the end of the program, students will be able to do the following:
- Explain the theory, principles and practice of sales and inventory management
- Describe best practice sales and inventory management processes
- Prepare for and participate effectively in Monday morning and monthly reviews
Detailed Content
Overview Of Merchandise And Category Management
- Merchandise management definition
- Category management definition
- Category management vs. inventory management
- Retail merchandising
Principles Of Inventory Management Fundamentals
- Cost of goods sold
- Average inventory
- Carrying costs of inventory
- Financial impact of inventory reductions
Key Performance Indicators (KPIs)
- ABC analysis
- Example ABC analysis and in stock service levels
- Inventory or stock turn
- Evaluating a change in turn
- Weeks of supply
- Markdowns
- Sell through
- Gross Margin Return on Investment (GMROI)
- Maximizing GMROI
Lost Sales
- Cost of avoiding a lost sale
- Lost sales estimation – continuity and fashion items
- Profit impact of lost sales recovery
- Using lost sales in practice
How Much Inventory Is Enough?
- How much inventory do you need?
- Safety stock
- Considerations for reducing inventory
- Which comes first – reducing stocks or reducing lost sales?
Important Basics
- Breaking stock and terminal stock
- Types of stock ownership
- Consignment stock
- Vendor Managed Inventory (VMI)
- Direct Store Delivery (DSD)
- Difference between sales and demand
- Inventory accuracy
- Fast movers vs. slow movers
- Packs
- Ratio packs
- Rounding rules
- Visual merchandising constraints
Not Quite So Basic
- Halo effect
- Cannibalization
- Price elasticity curves and cannibalization
- Price optimization data considerations
- Price optimization – example strategies
- Common inventory management errors
Buying
- Buying differences – merchandise management vs. category management
- How much do you buy?
In-Season Sales And Inventory Management
- Summary of the merchandise management process
- A typical Monday morning review
- Performance against chain average
- Sales to stock ratio (participations)
- A problem department?
- Last n weeks trend
- Example monthly review
- Questions to investigate
- Position sheet analysis
- Open to Buy management
- Open to Buy example
- In season control
- Complicating factors
- Impact of stock ownership on OTB
Mastery Test
Benefits of Studying This Program
Learners studying this program will gain familiarity with sales and inventory management processes faster, shortening their path to full productivity. Suppliers to consumer goods companies will be able to identify opportunities where they can help their clients improve.
Hours of Study
About 5 to 6 hours. However, we recommend individual sessions of about 30 minutes in order to retain as much knowledge as possible.
Pre-Requisites Necessary
None, but if learners have no previous retail knowledge, it would be good to have studied the Overview of Key Retail Processes and Buying & Merchandising Overview modules first.
After This Program
The next logical program in developing learners’ knowledge will depend on your learning goals, but will most likely include some of Merchandise and Assortment Planning, Forecasting, Allocation and Replenishment. You can get more guidance from the Career Paths section of this web site.


Share & Forward To A Friend
Share
Sales and Inventory Management Class | Martec Intenational
Facebook Twitter Email Pinterest Telegram