Martec’s Approach to Return on Investment Analysis
Increasingly L&D Departments are pressured to develop a business case assessment of the financial return for a given investment in training or upskilling. This page describes Martec International’s approach to doing this. Our clients can use this model and methodology to provide their leadership with the necessary business case.
The key components of our approach are:
- To assess the quantifiable business benefits of the the impact of an L&D project on those parts of the business that generate the sales and gross margin, and create net reductions in expense costs, reduce the inventory carrying cost and improve free cash flow.
- A percentage of training projects occur when major IT investments are made, and our approach can incorporate elements of any capital investment project alongside its L&D contribution.
- We build our assessment using a bottom up approach tied to individual key performance indicators, such as comp store sales growth, achieved gross margin, and increased inventory turns to enable implementation tracking at a level that allows detailed identification of elements of the business case that are not working, so they can be remediated, if necessary.
- Our model presents results using the internationally recognised profit and loss statement, a partial balance sheet and a net cash flow statement, together with an internal rate of return (IRR). Chief financial officers immediately feel comfortable with an information format they see regularly.
- We also include a simulation capability, so that different scenarios can be evaluated. Running simulations preserves the original input data to avoid repeatedly having to re-enter it to the model, and alternatives can be evaluated in seconds.
- The initial ROI analysis is based on forward projections of benefits created using past experience. Consequently, they can include a margin or error. Among other things, the simulation capability can be used to see by how far these projections can be missed and still show a positive benefit.
We start the process of populating the model with a summary level P&L account from the last year before implementation commences.
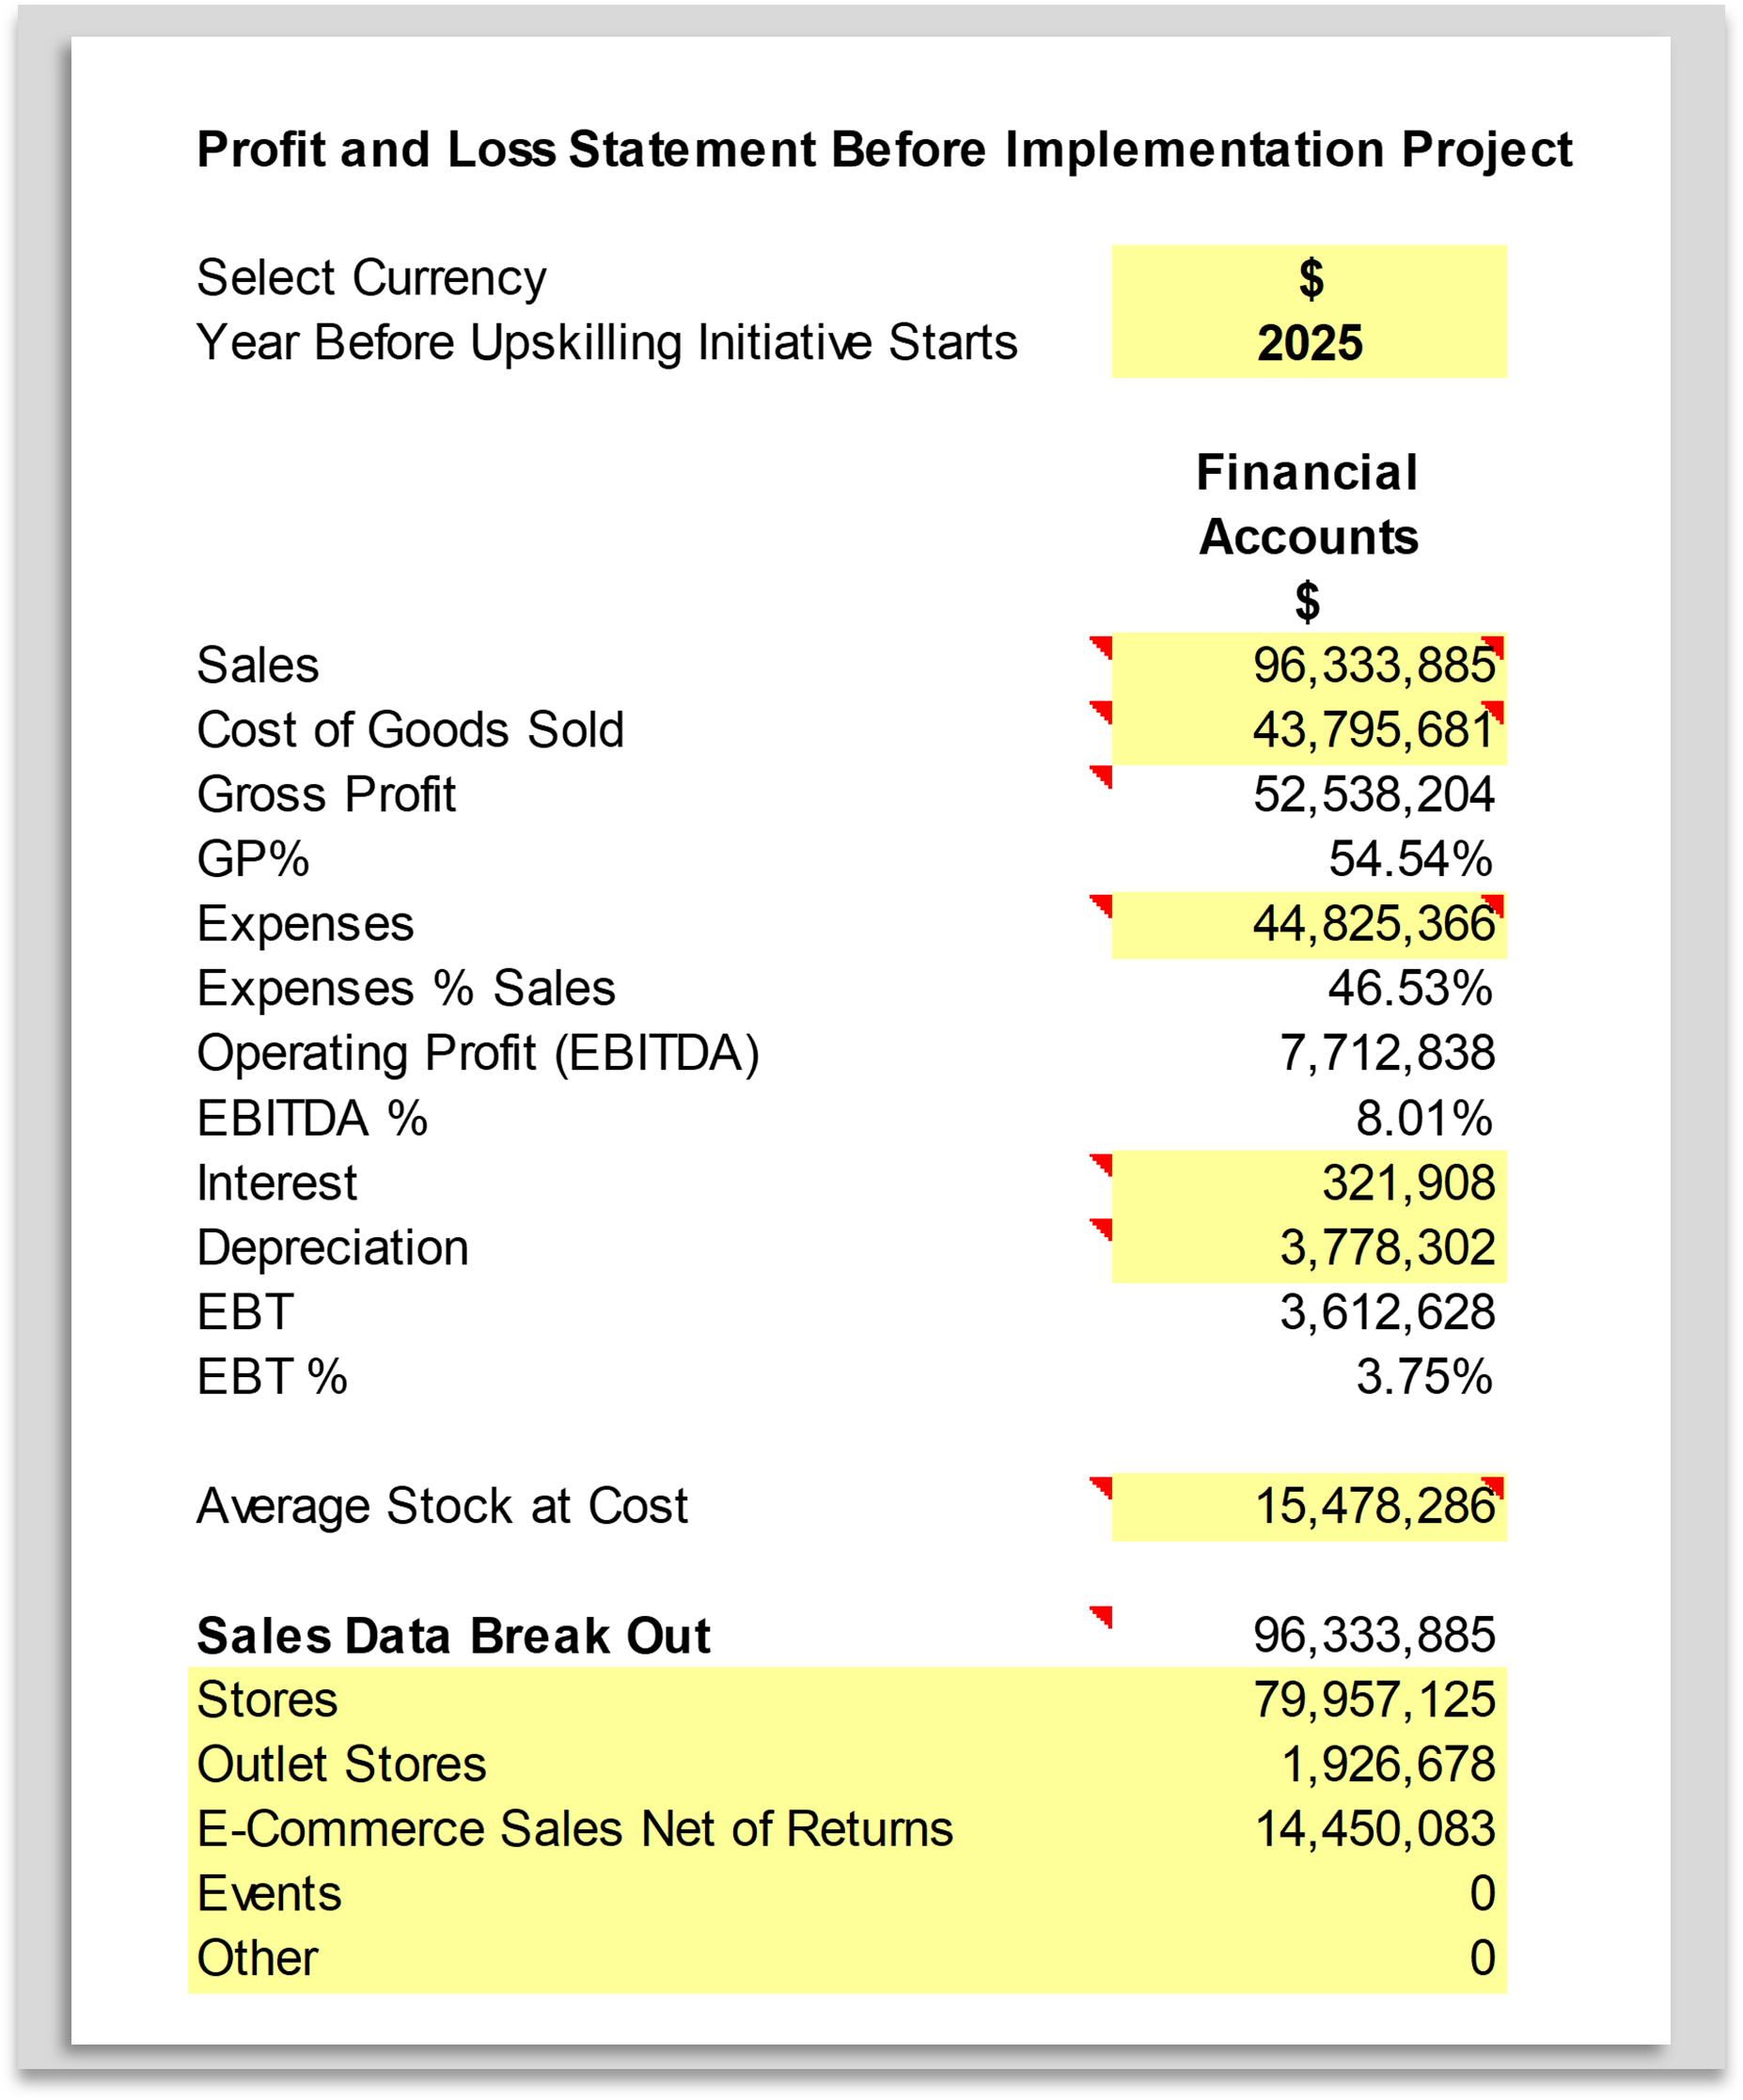
This is the baseline that improvements are measured against.
The next part of the model measures the estimated increases in sales from two major areas:
- Improving availability on shelf for consumers via a mixture of better demand forecasting and improved inventory management, such as smarter purchasing, better allocations, and replenishment processes, reducing waste ,lower terminal stocks at season ends.
- Improved sales via Store Operations, by improving merchandise presentation, enhancing customer service, deploying greater sales skills, partly through training and partly through reduced employee churn, removing some lost sales through faster time to full productivity.
- This also includes improvements in online productivity.
Having determined how sales might be achieved, the next step is to assess gross margin improvements as shown below.
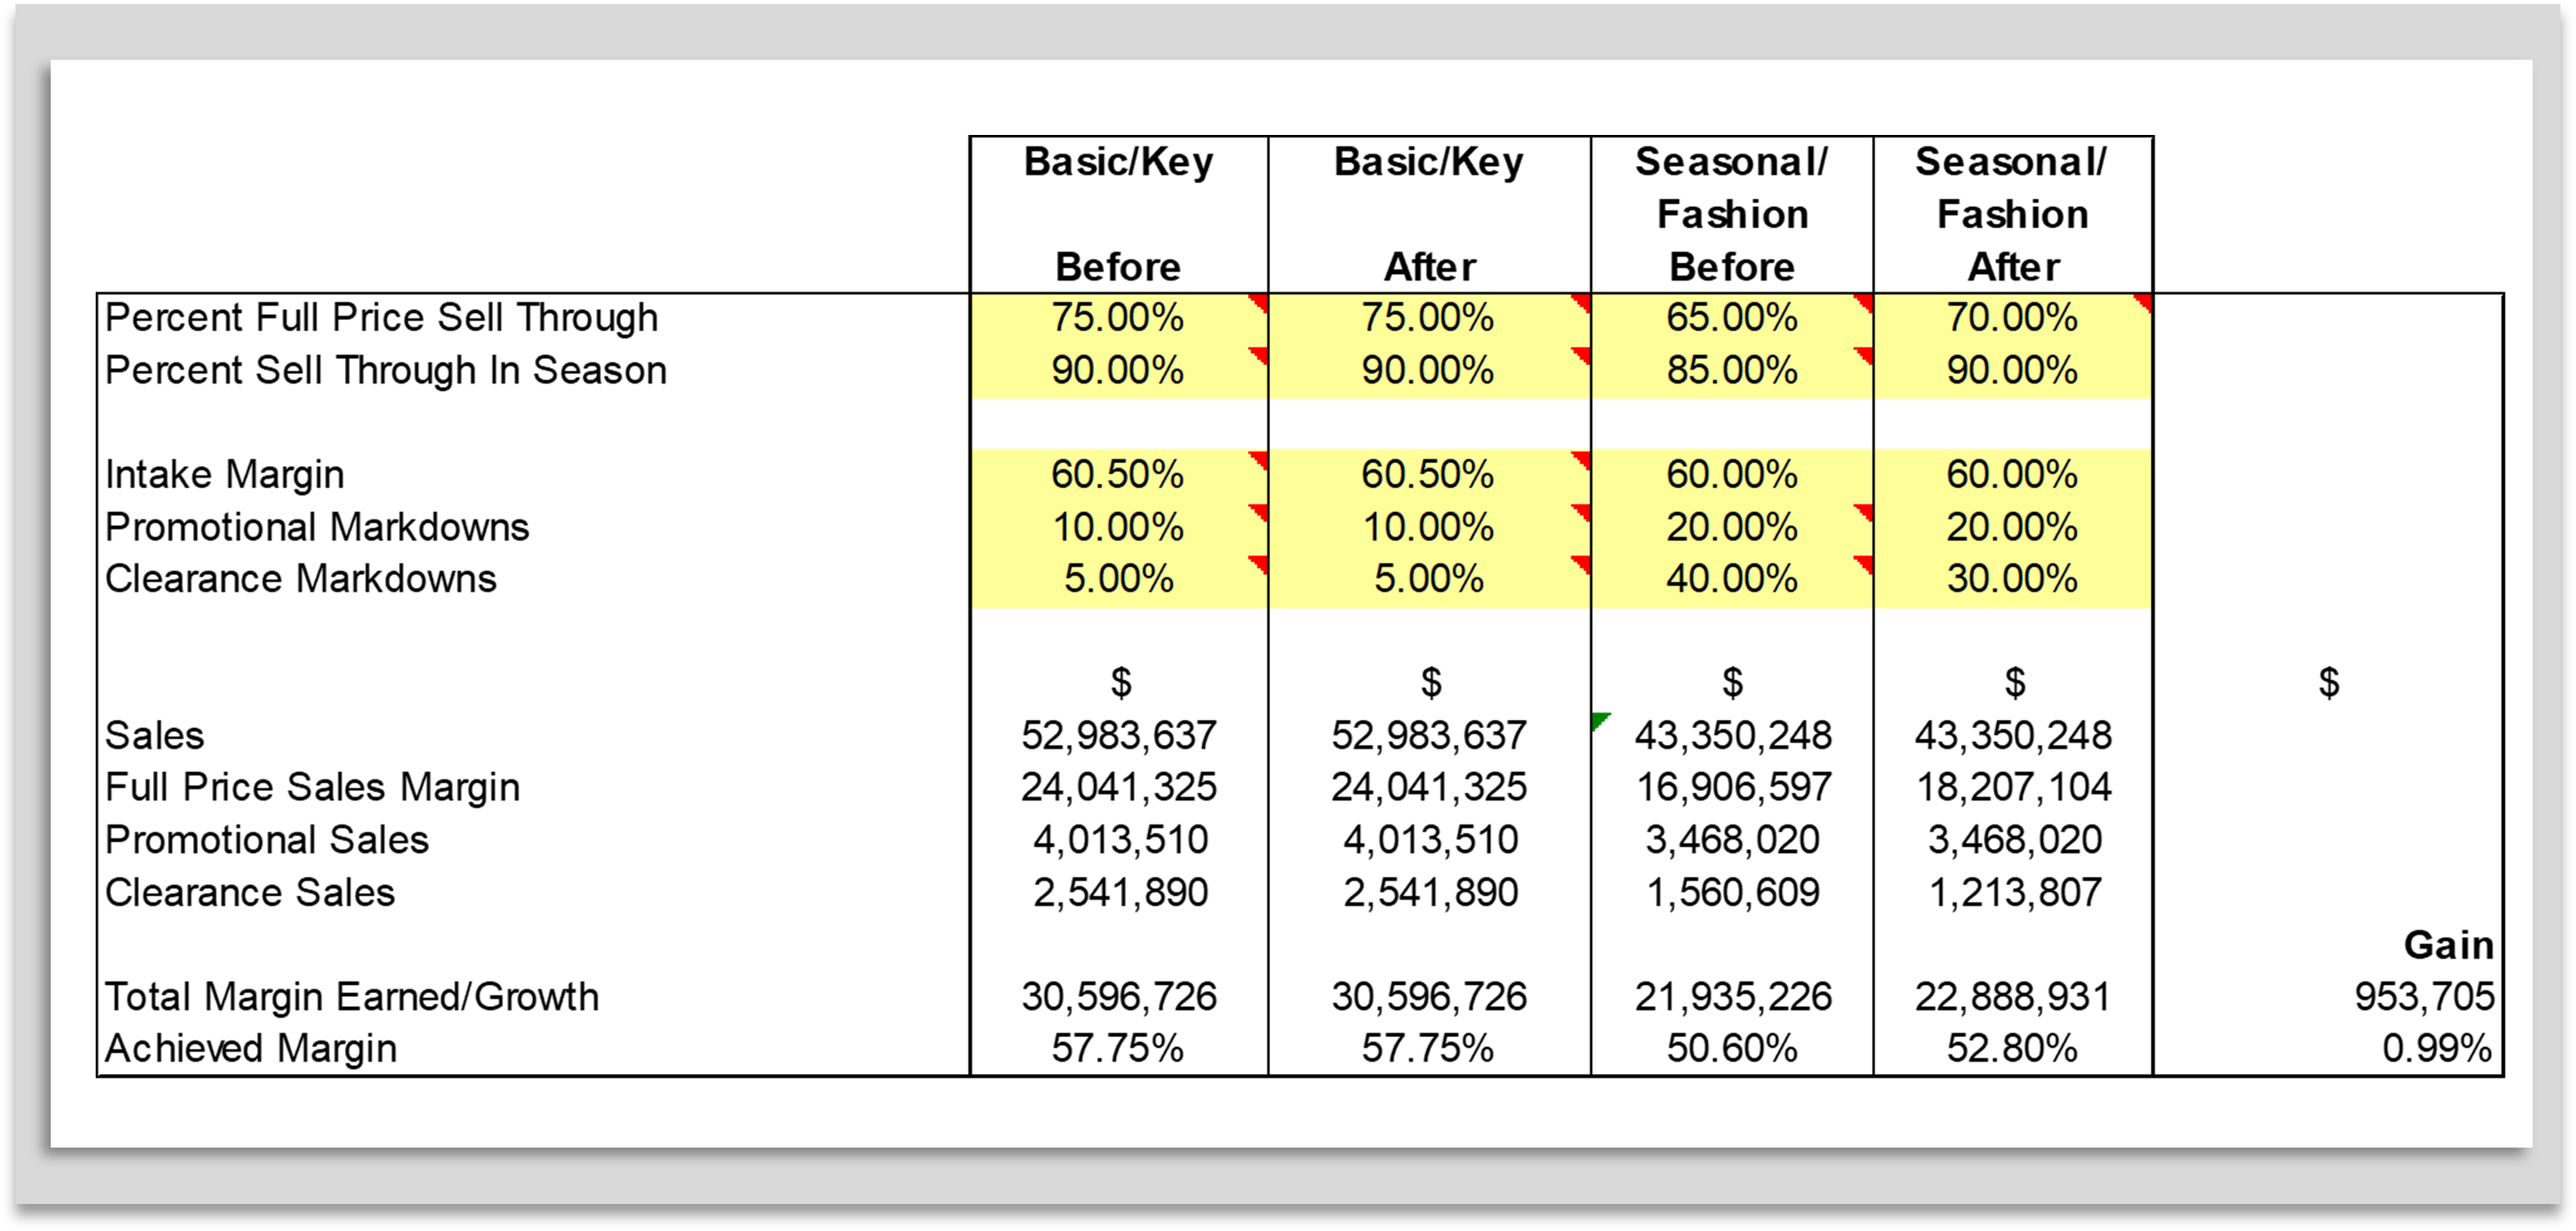
These are achieved by tighter control of inventory, more accurate forecasting, earlier identification of sell through problems and hence lower clearance markdowns.
Having assessed gross margin improvement, a supply chain analysis is conducted to predict the impact on changes to cycle time and safety stock inventory and potential improvement in inventory turn.
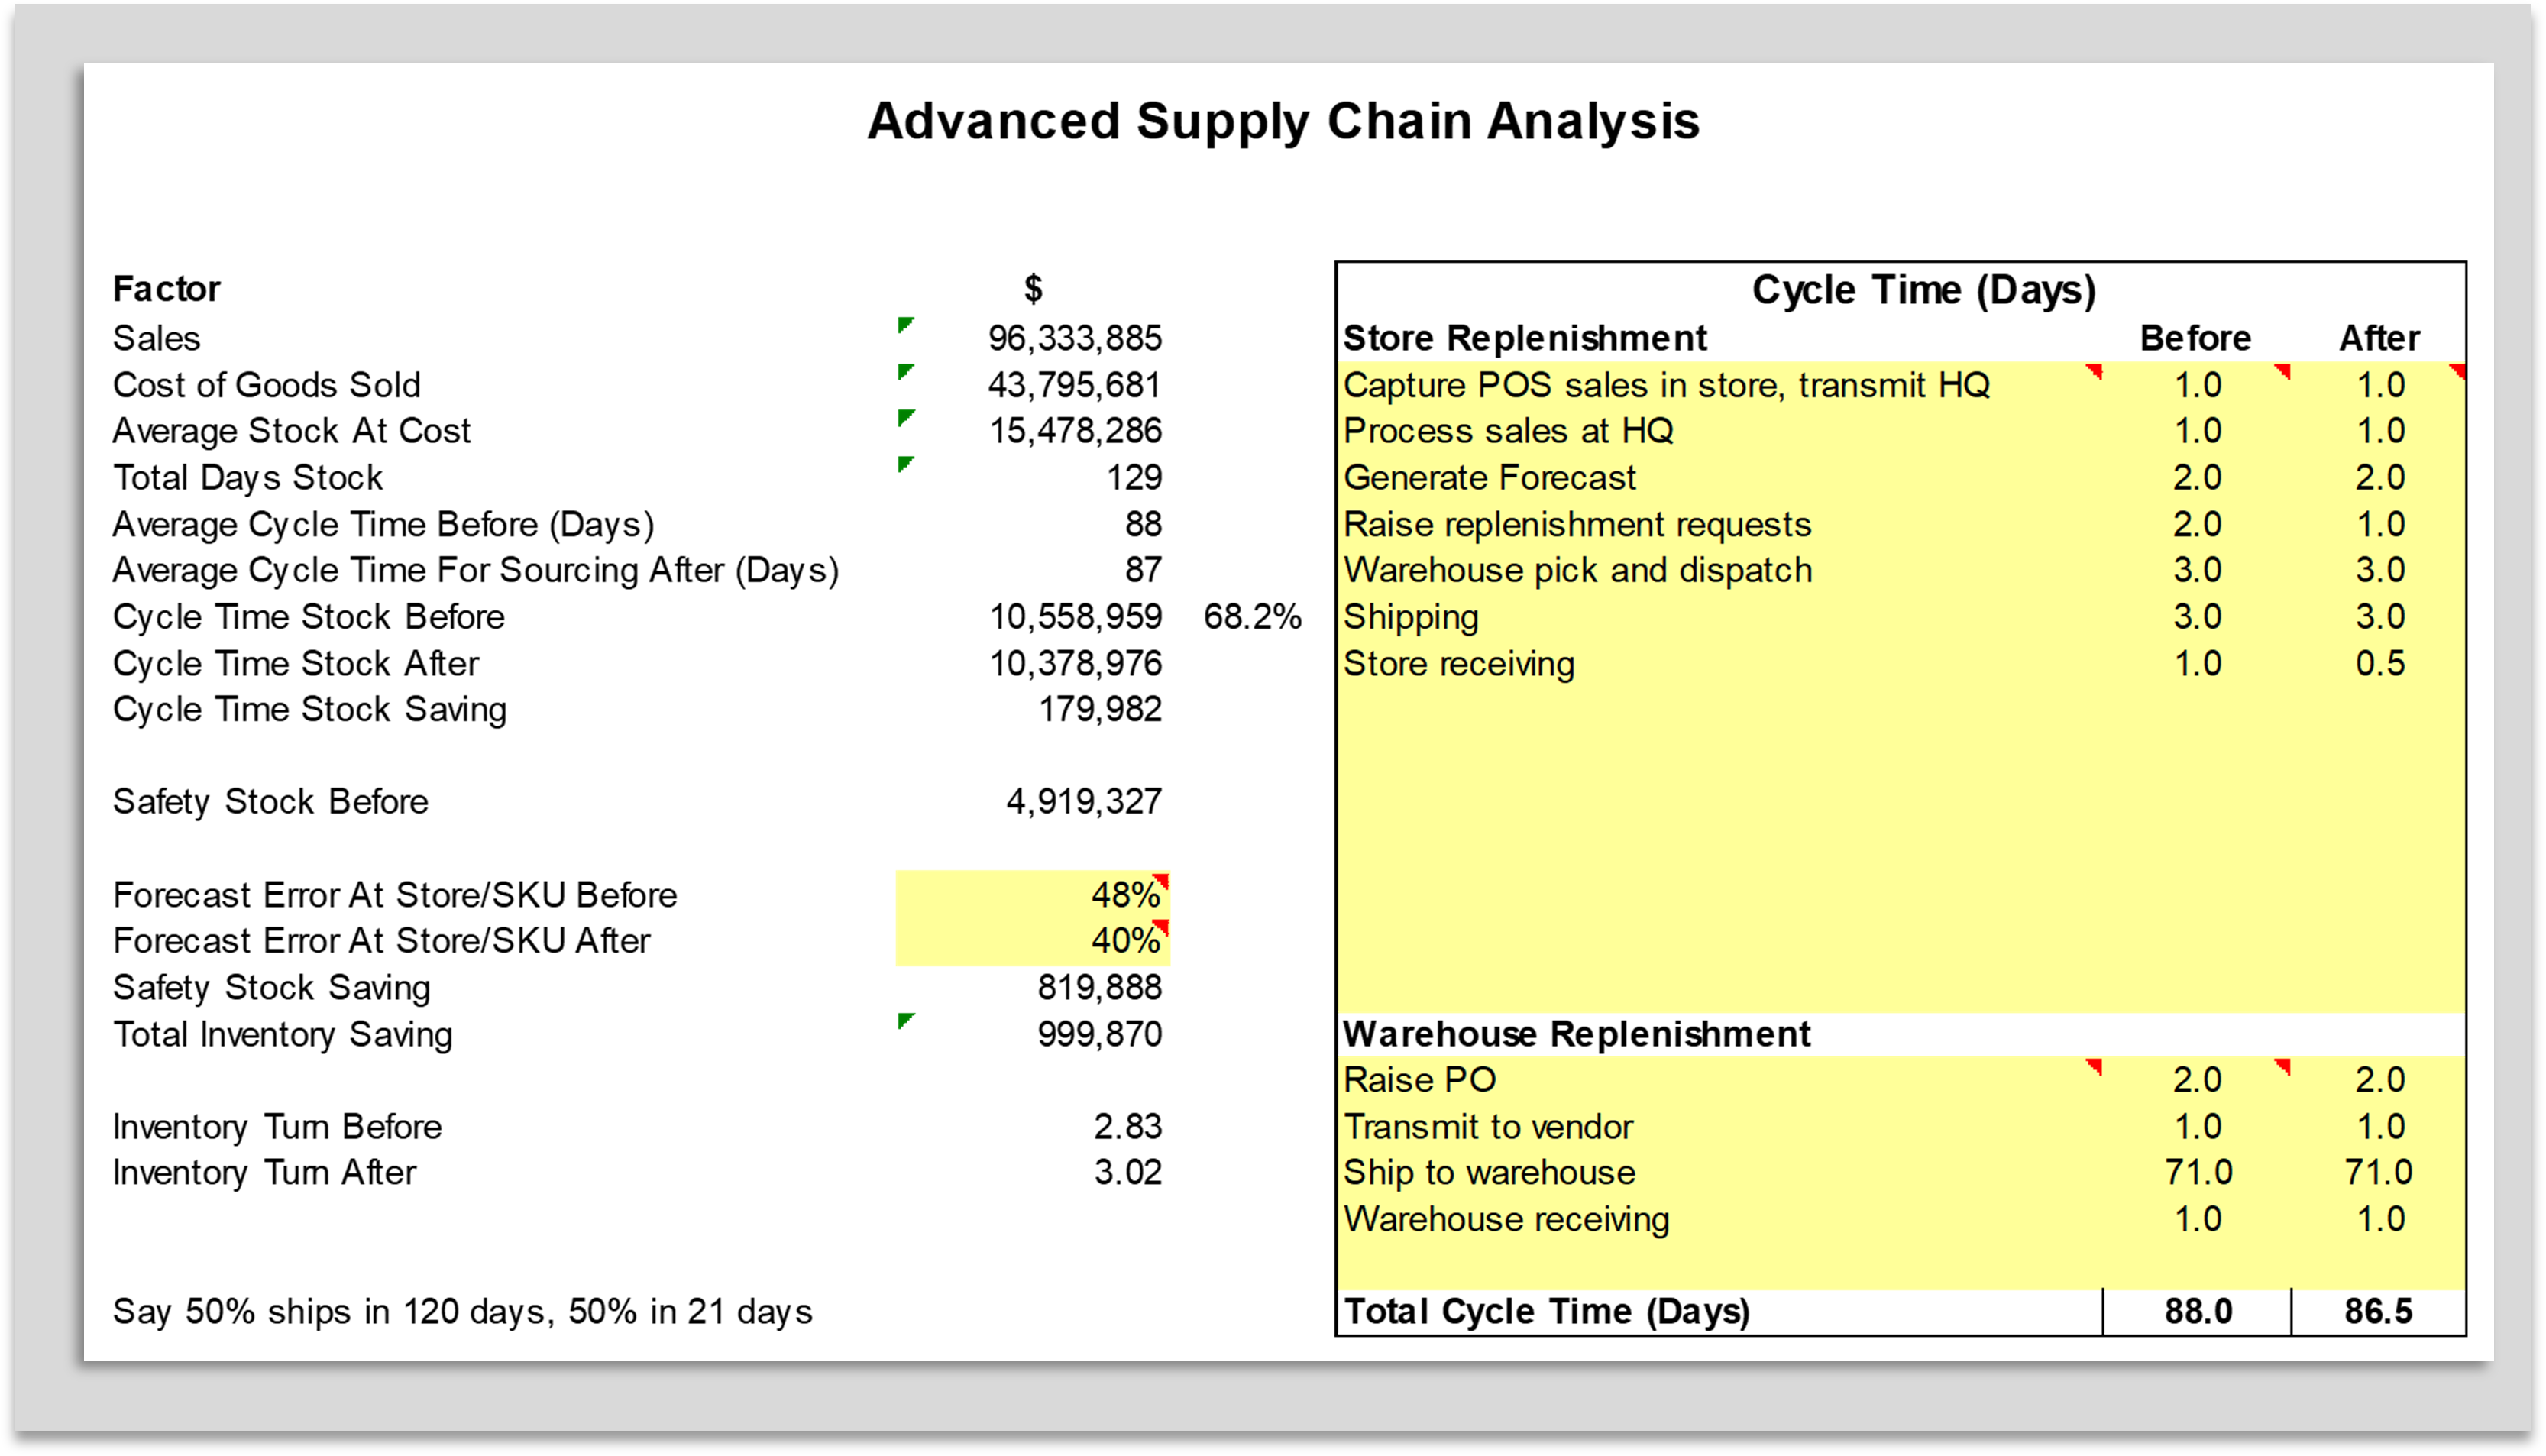
Stock improvement derives from:
- Better Flow Planning - Phasing receipts more smoothly through the season
- Clustering - Tailoring range width and depth to store clusters and use of Internet
- Demand Forecasting - Buy right more often, shorten cycle times. lower safety stocks
- Replenishment - More accurate calculation of needs, faster production of pick
- Inventory Planning - Better service levels, re-forecasting in season, long tail management
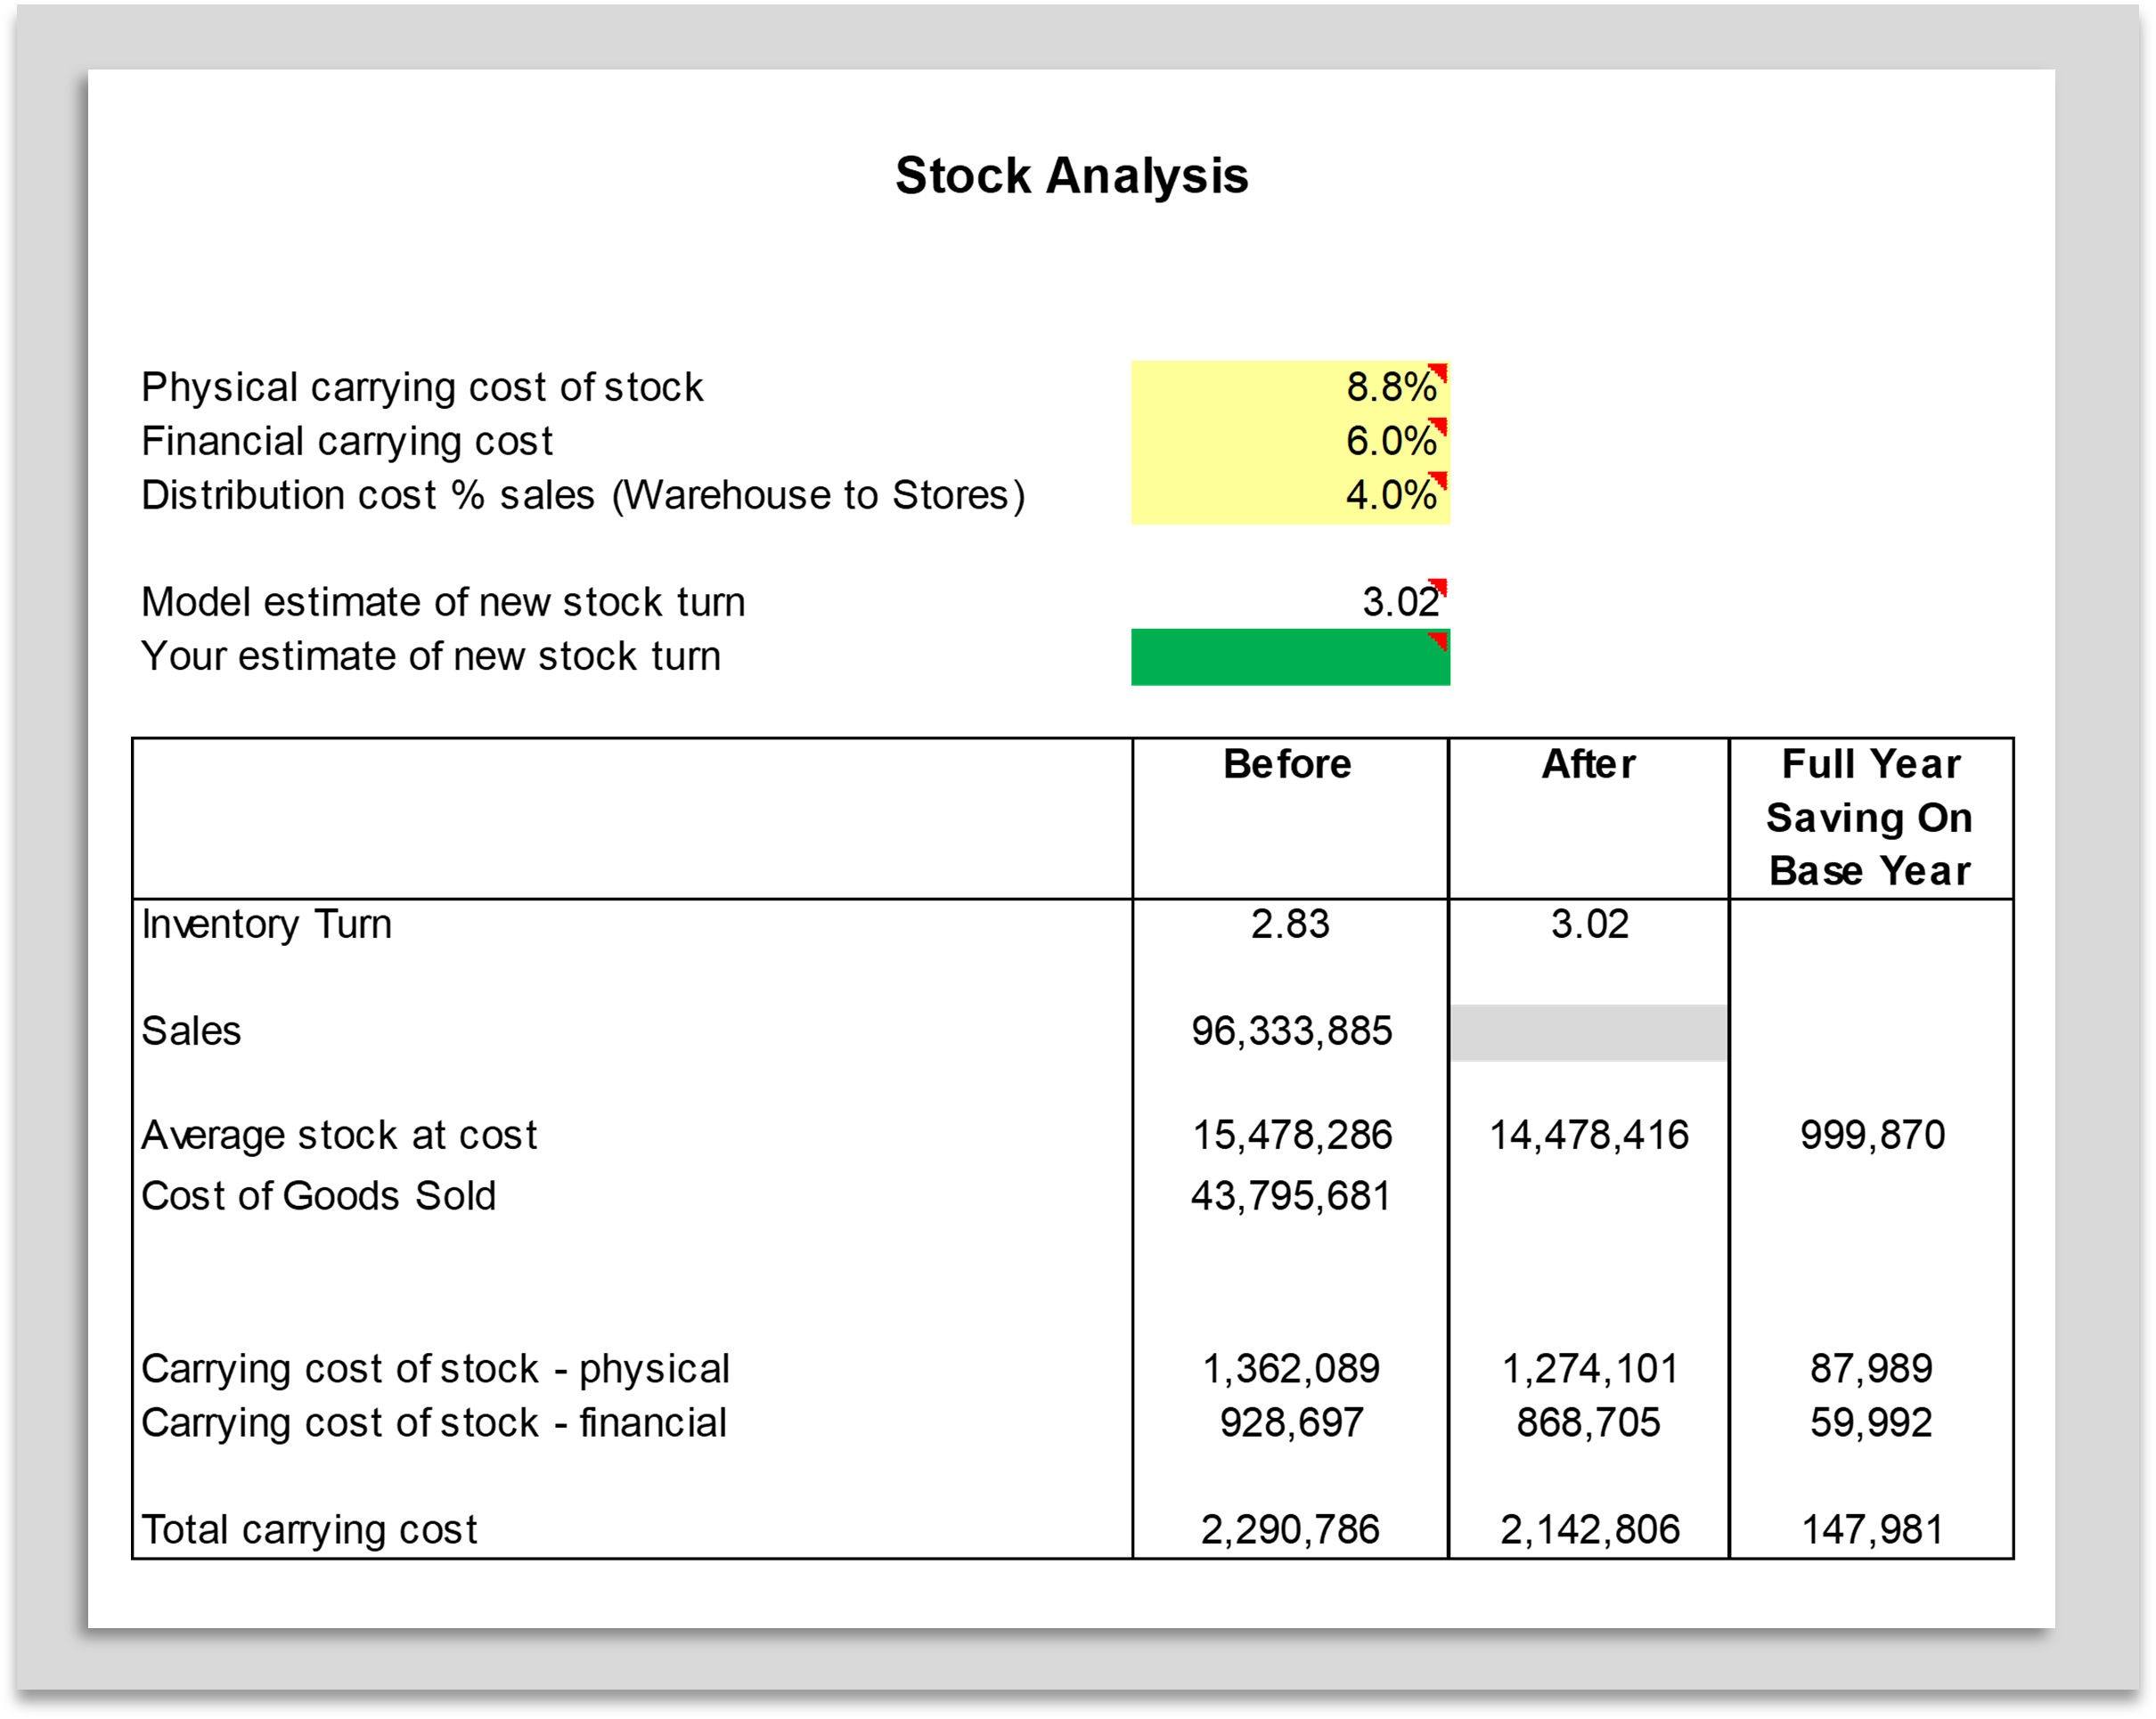
The above changes are passed to the next analysis to assess inventory carrying cost reductions.
The next step is to focus on expense costs. One aspect is to identify the training costs that can be removed from the P&L because they will be replaced by a new set based on the budget for the upskilling project. There are other associated expenses such as recruitment costs, which will reduce as attrition is reduced.
There may be a headcount increase due to opening additional stores or warehouses, for example, or there may be reductions due to the impact of AI or other “system” improvements. The headcount changes may have been identified in the workforce management plan if one has been produced.
Following the HR cost adjustments, the project costs, both Capex and Expenses, can be determined on another work sheet to factor into the expenses section of the P&L, and also the cash flow statement.
Finally, the results can be reviewed in the following two reports – the Profit and Loss with some extra Balance Sheet Data and a cash flow changes summary.
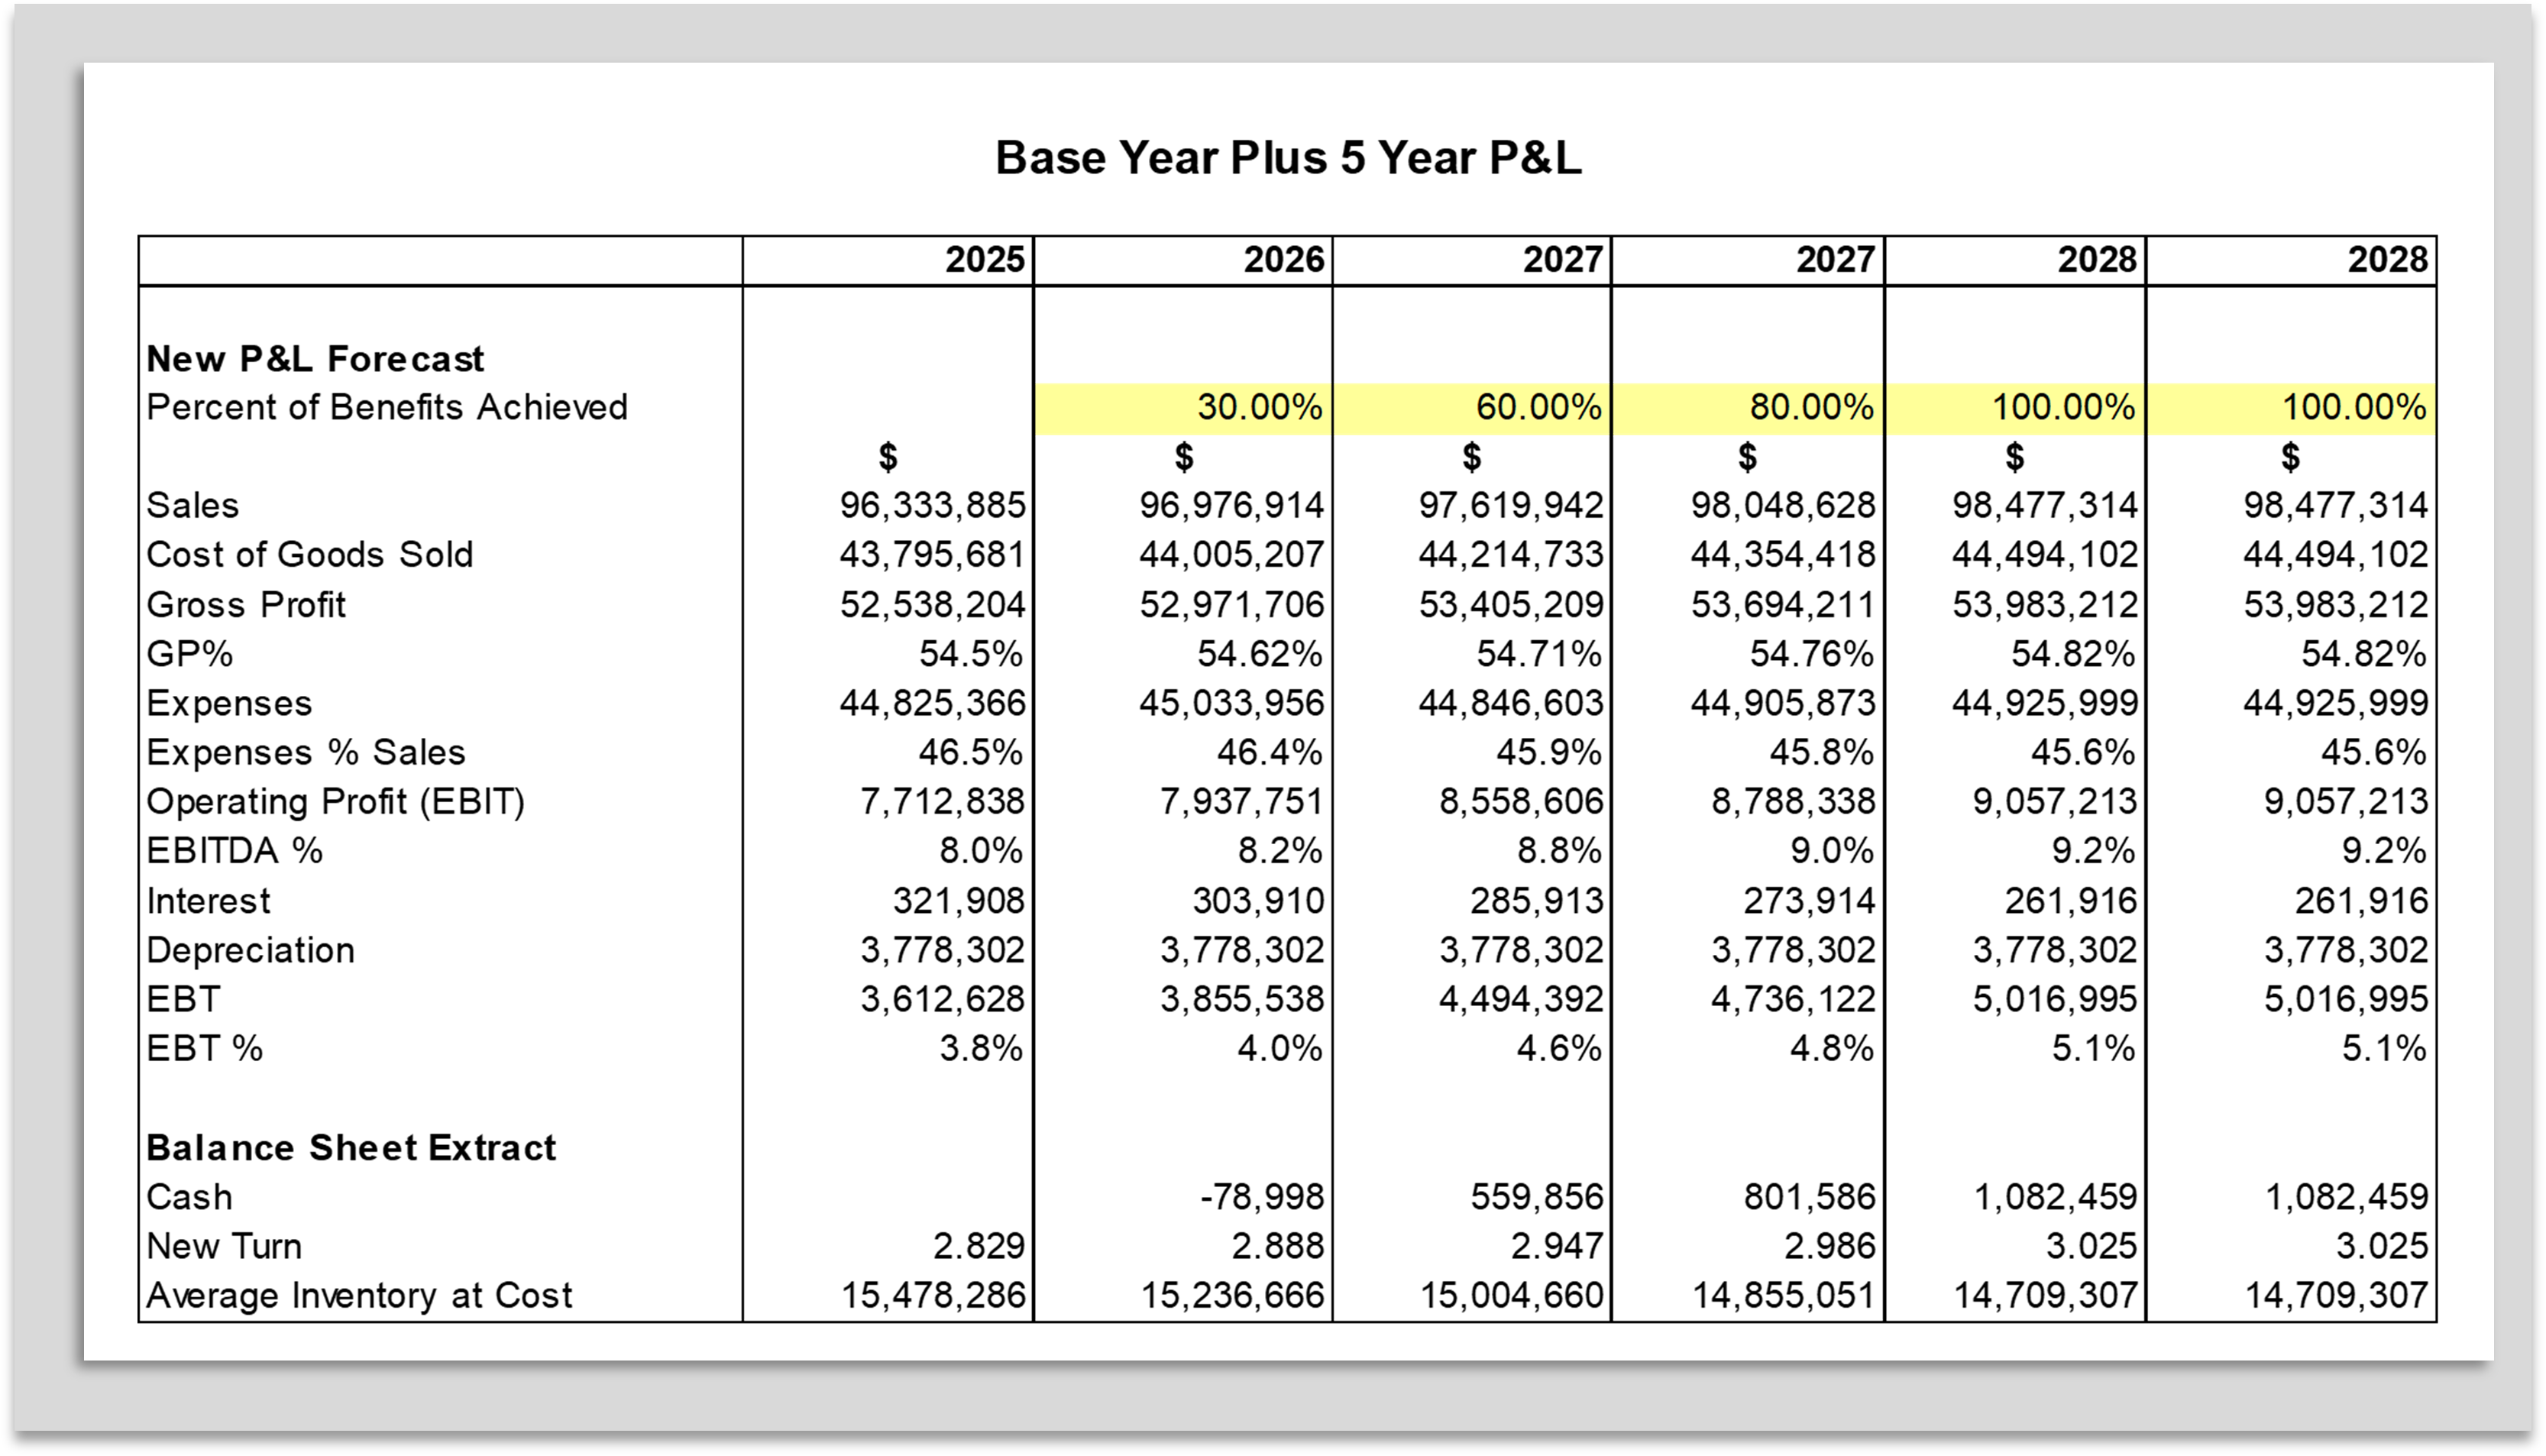
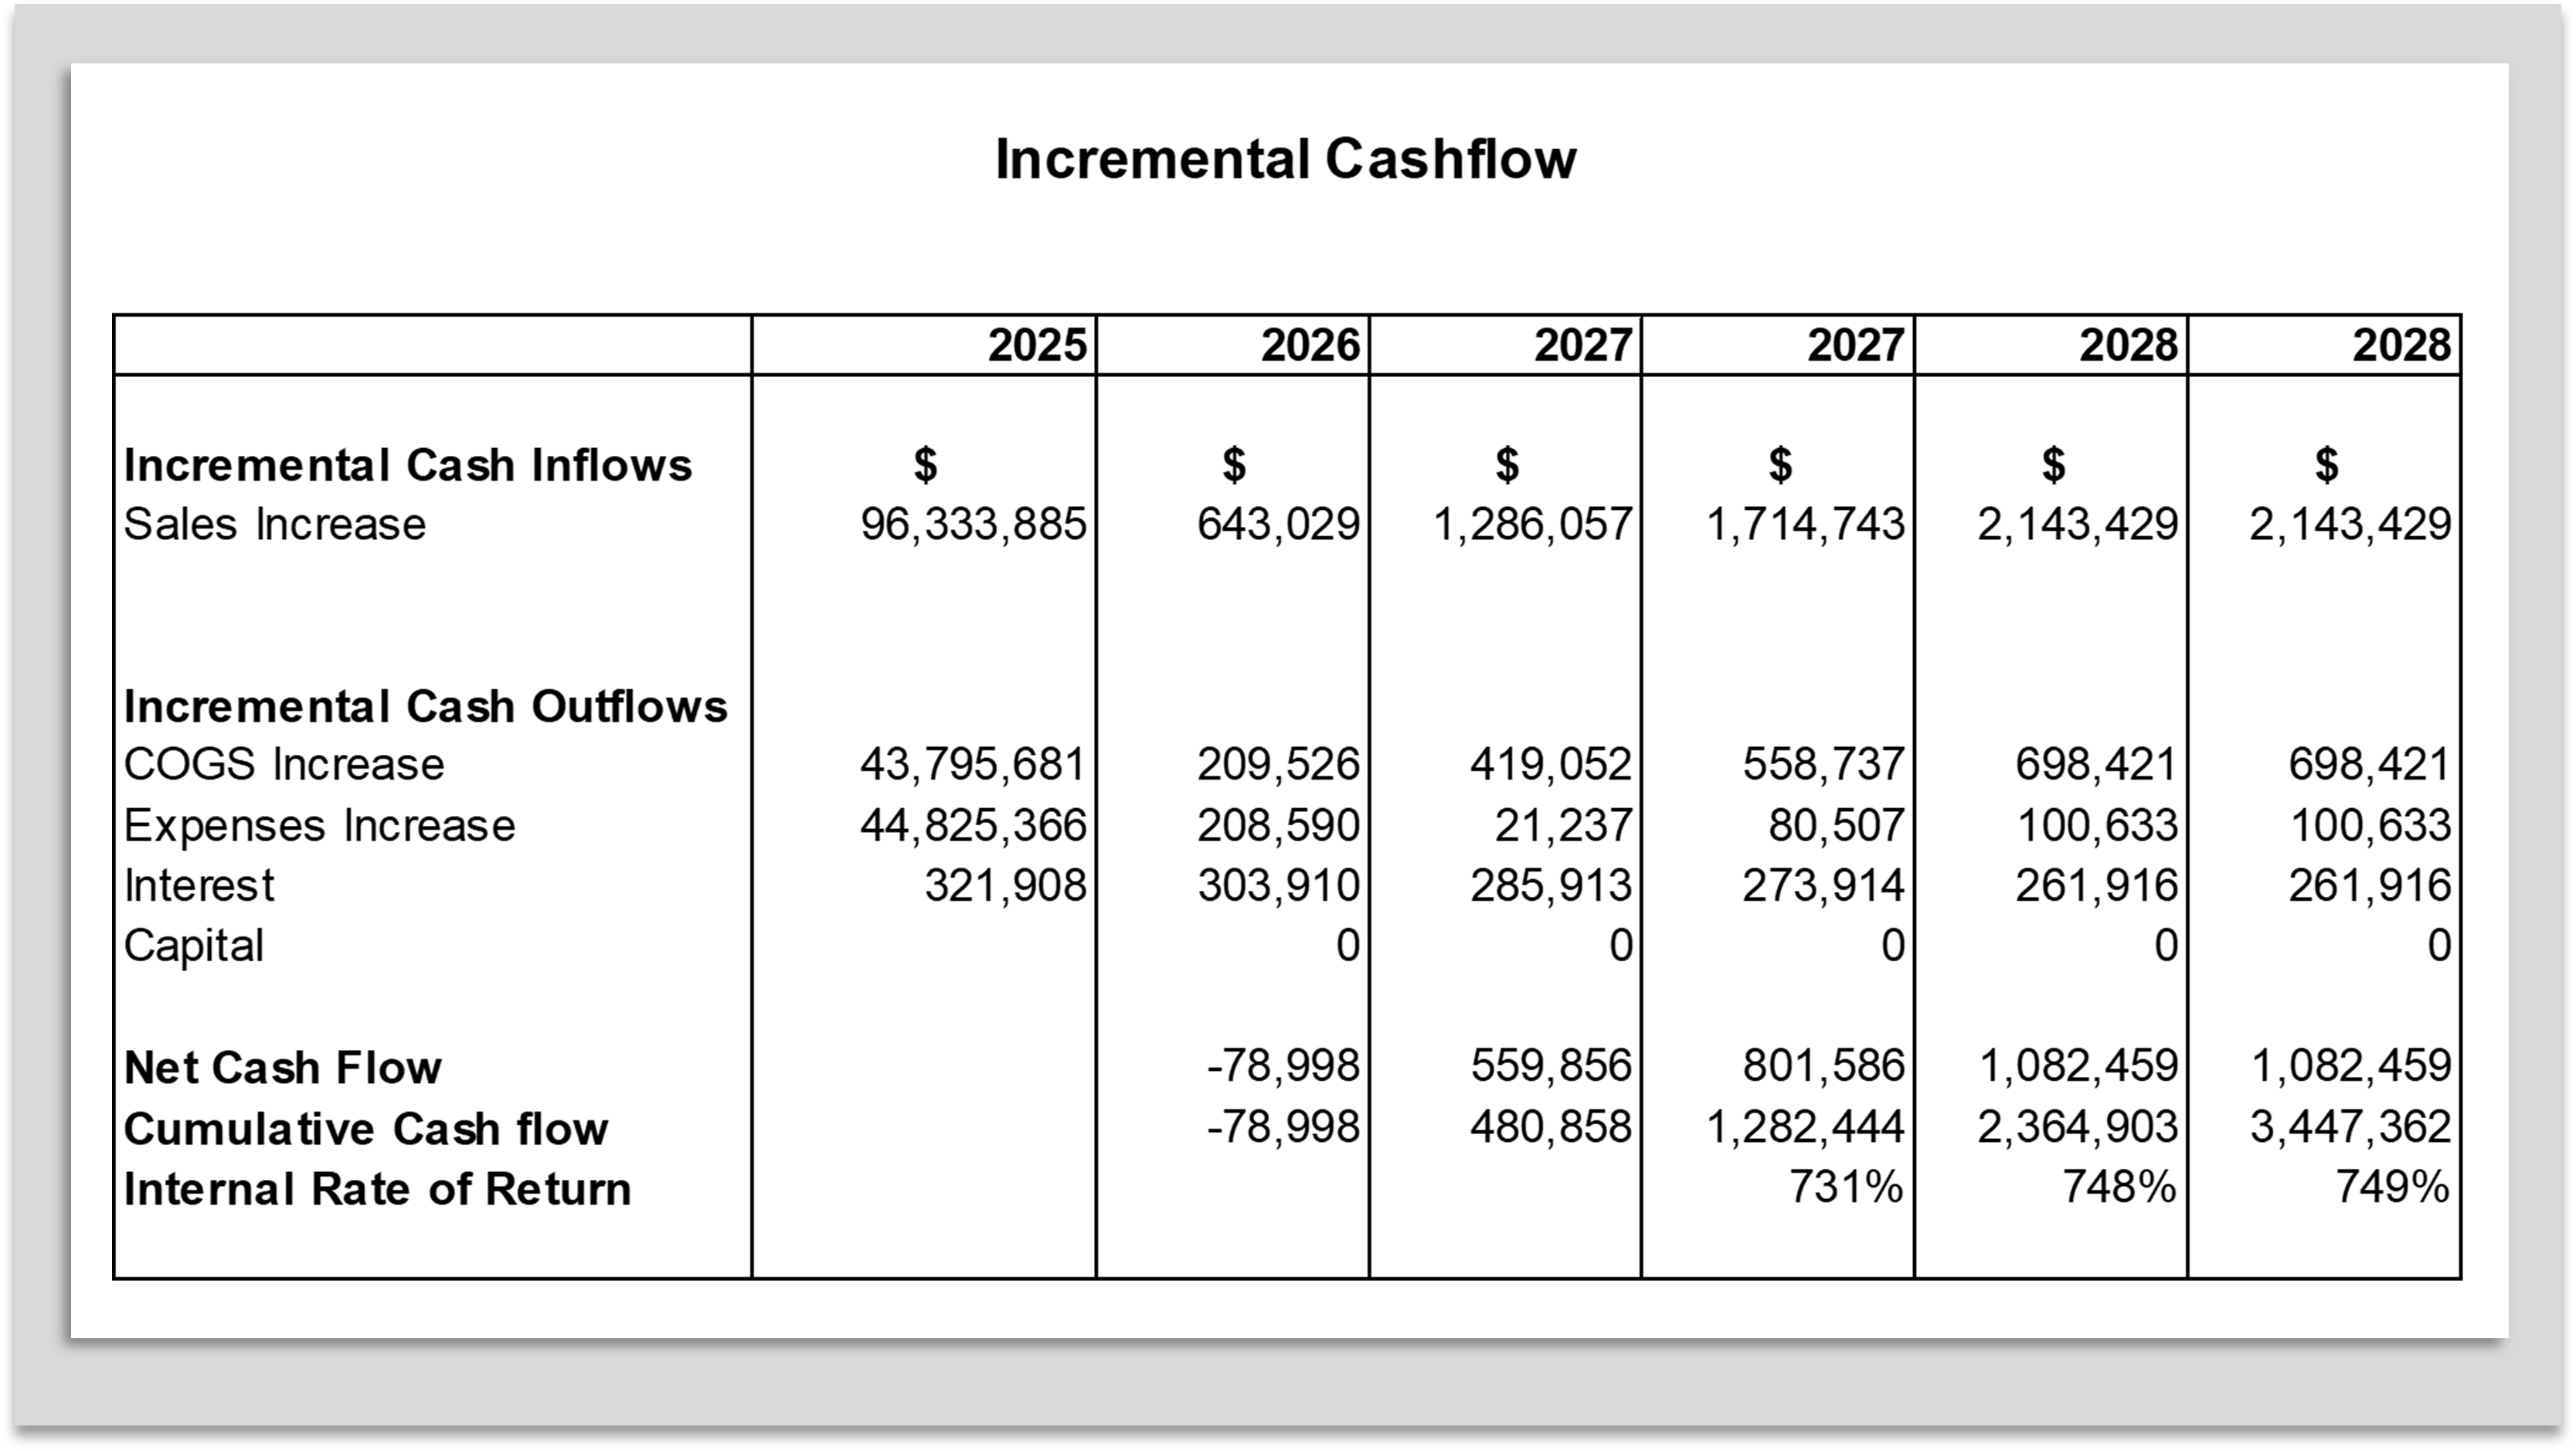
In this example, the project has a negative cash impact in 2026 because of the main investment costs for the project and a near breakeven net cash figure in 2027. Over the subsequent 3 years the cash position builds nicely.
At this stage, a project manager could re-visit the assumptions and decisions made in the model, possibly adjusting the speed of rollout of the project to reduce the size of the outflow in 2026 and perhaps make 2027 a small positive.
Throughout the population of the model and simulating changes to key areas, the dashboard is visible on most workbook sheets, and it updates in real time, so that you can see the immediate impact of changes.
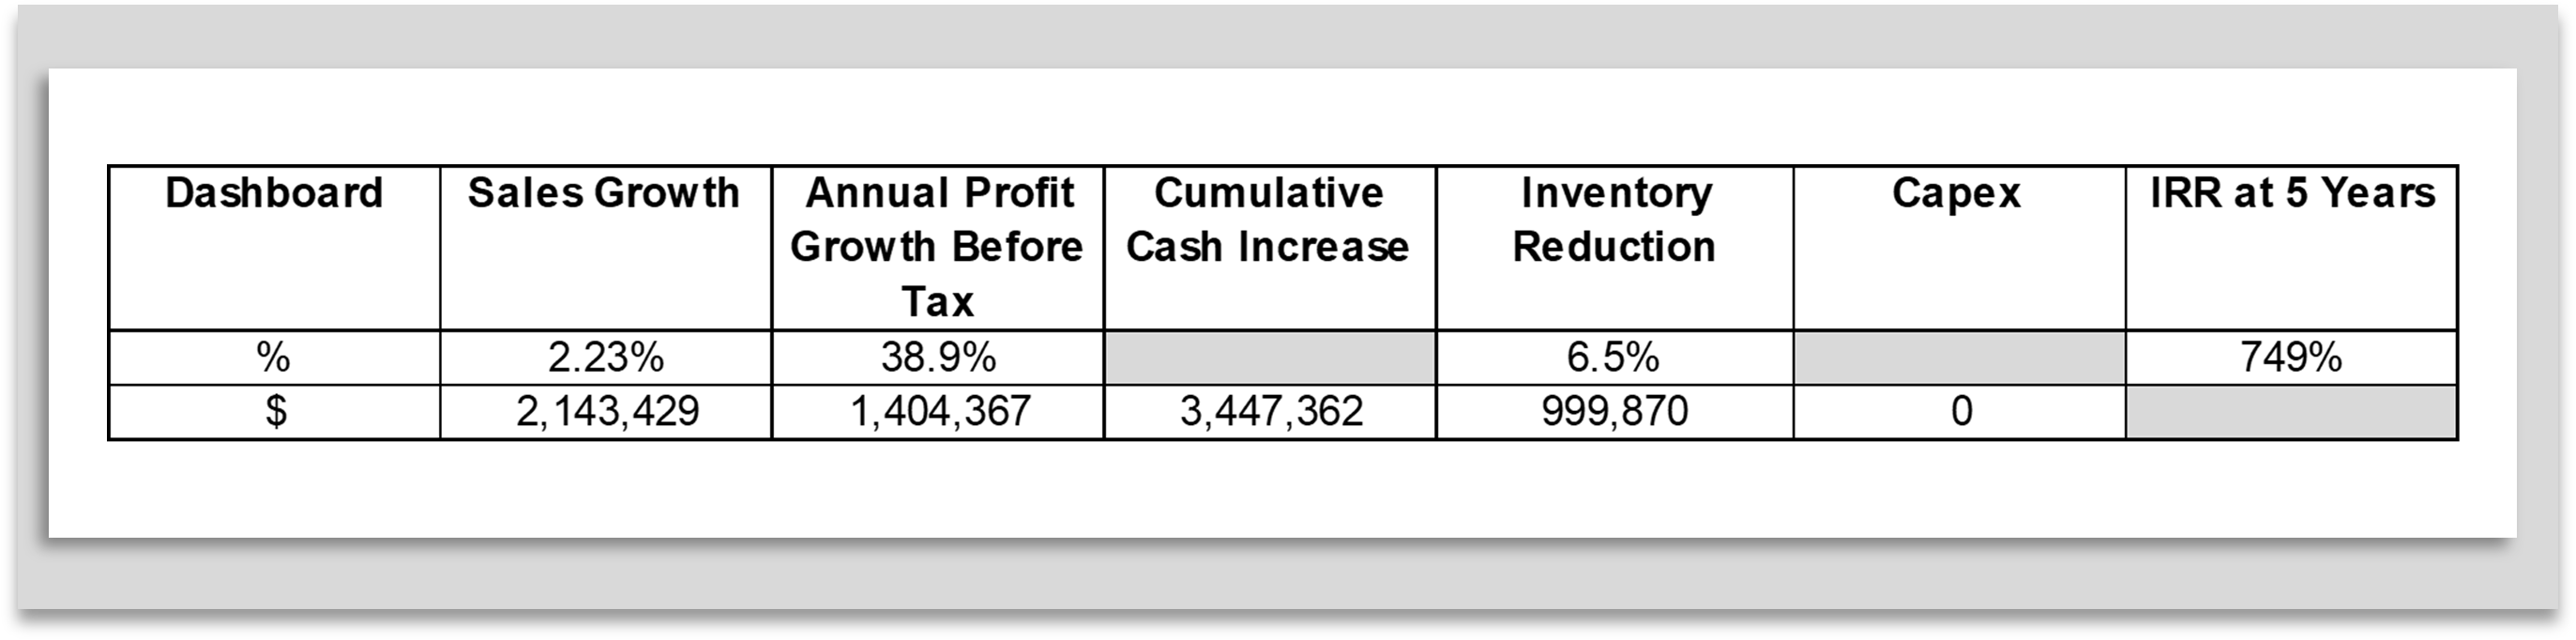
Once the first pass through the model is complete, the project manager can make successive passes through reviewing assumptions, testing changes, identifying the most sensitive aspects to get right and generally tuning the analysis, to identify the most suitable implementation version for the company.
As the training is progressively tracked at KPI level of detail, confirmation that everything is on plan is possible or exceptions can be identified and remediated as necessary.
The KPI assignments in the workforce planning model learning paths coupled with the individual employee progression, shown in the example below, will facilitate this.
![]()
Clients who adopt the Martec Upskilling and Reskilling methodology can acquire the Upskilling and Reskilling Toolkit via the Martec International shop and this includes a copy of the model, and also an e-learning class involving 3 to 4 hours of study, which takes you through the process of conducting analyses like these in much more detail than addressed here. You can learn more about the class here.